Case4. ユーザーの旅行先を予測する
- データの理解
与えられたデータについて見ていき、現状把握や、旅行先を予測する材料を探っていきます。
コンペでは、他にwebサイトのログなどの情報もありますが割愛します。
kaggle data description (データの説明)
データセットのユーザーはすべて米国出身です。 目的地は次の12(国)項目に分類されます。
「US」「FR」「CA」「GB」「ES」「IT」「PT」「NL」「DE」「AU」「NDF(予約なし)」「other」
ここからは、実際にデータを整理していきます(コード部分に興味のない人はコードは読み飛ばして頂いて結構です)。
参考:
https://www.kaggle.com/joetheshow/airbnb-visualizations
https://www.kaggle.com/lkirch/examiningairbnbdata-r
準備
# ライブラリの読み込み
library(data.table)
library(dplyr)
library(ggplot2)

# データの読み込み
train <- fread("./data/case04_train_users_2.csv", showProgress = FALSE, data.table = FALSE)
ユーザーの旅行先
group_by(train, country_destination) %>%
  summarise(count = n()) %>%
  ggplot(aes(x = as.factor(country_destination) , y = count)) +
  geom_bar(stat = "identity") +
  labs(x = "country_destination", y = "count")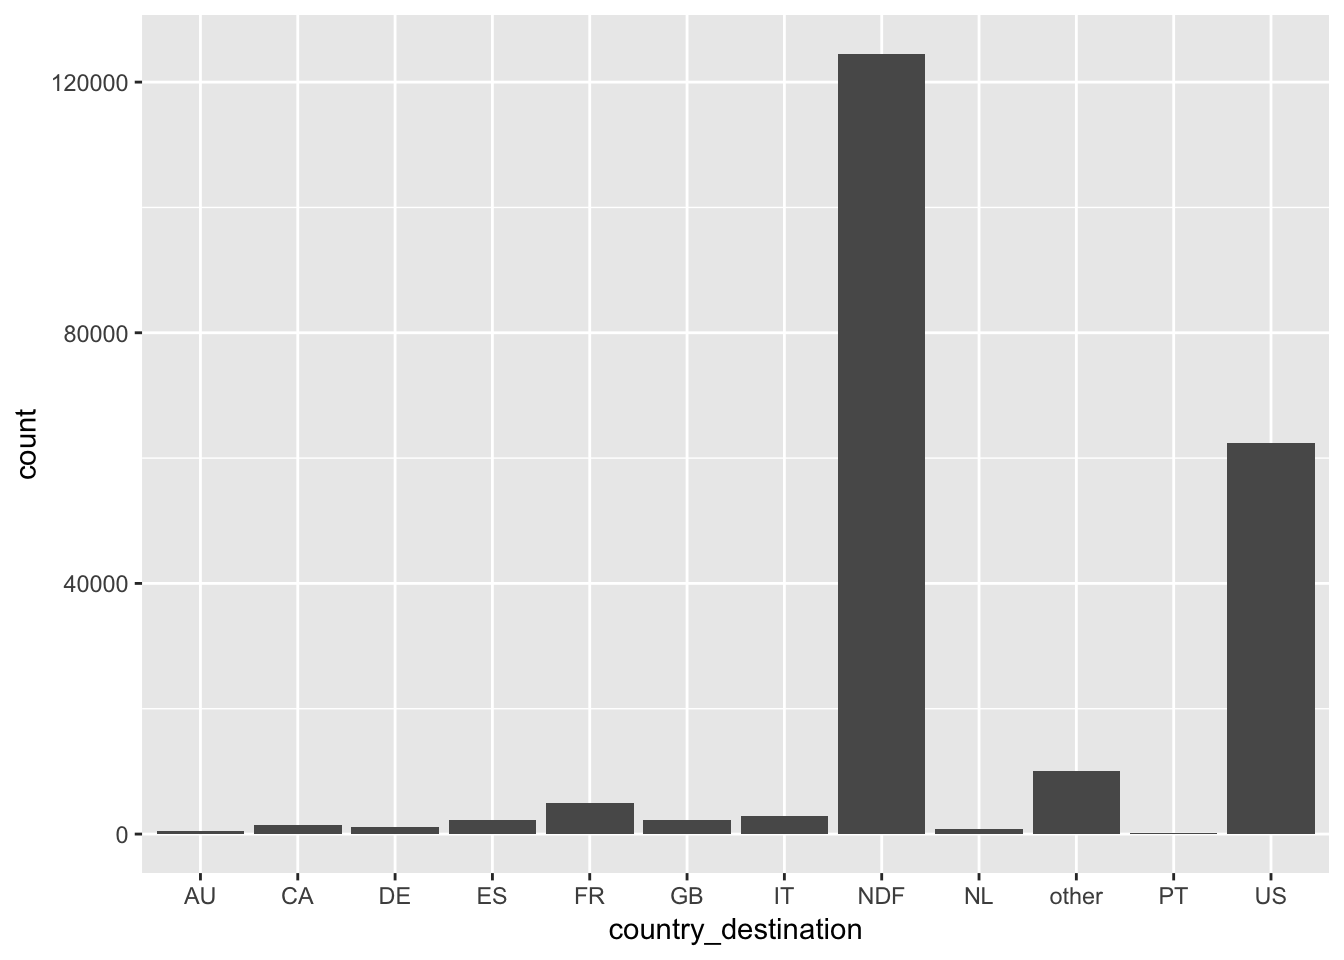
約6割のユーザが旅行には利用しておらず、データソースが米国人なので旅行の行き先はほぼ国内(US)であることが分かる。
ユーザーの年齢
filter(train, !is.na(age) & age < 100) %>%
  ggplot(aes(x = age)) +
  geom_histogram()
## `stat_bin()` using `bins = 30`. Pick better value with `binwidth`.
ユーザの中心が30代
使用アプリと旅行先
group_by(train, signup_app, country_destination) %>%
  summarise(count = n()) %>%
  ggplot(aes(x = as.factor(signup_app), y = count, fill = country_destination)) +
  geom_bar(stat = "identity") +
  labs(x = "signup_app")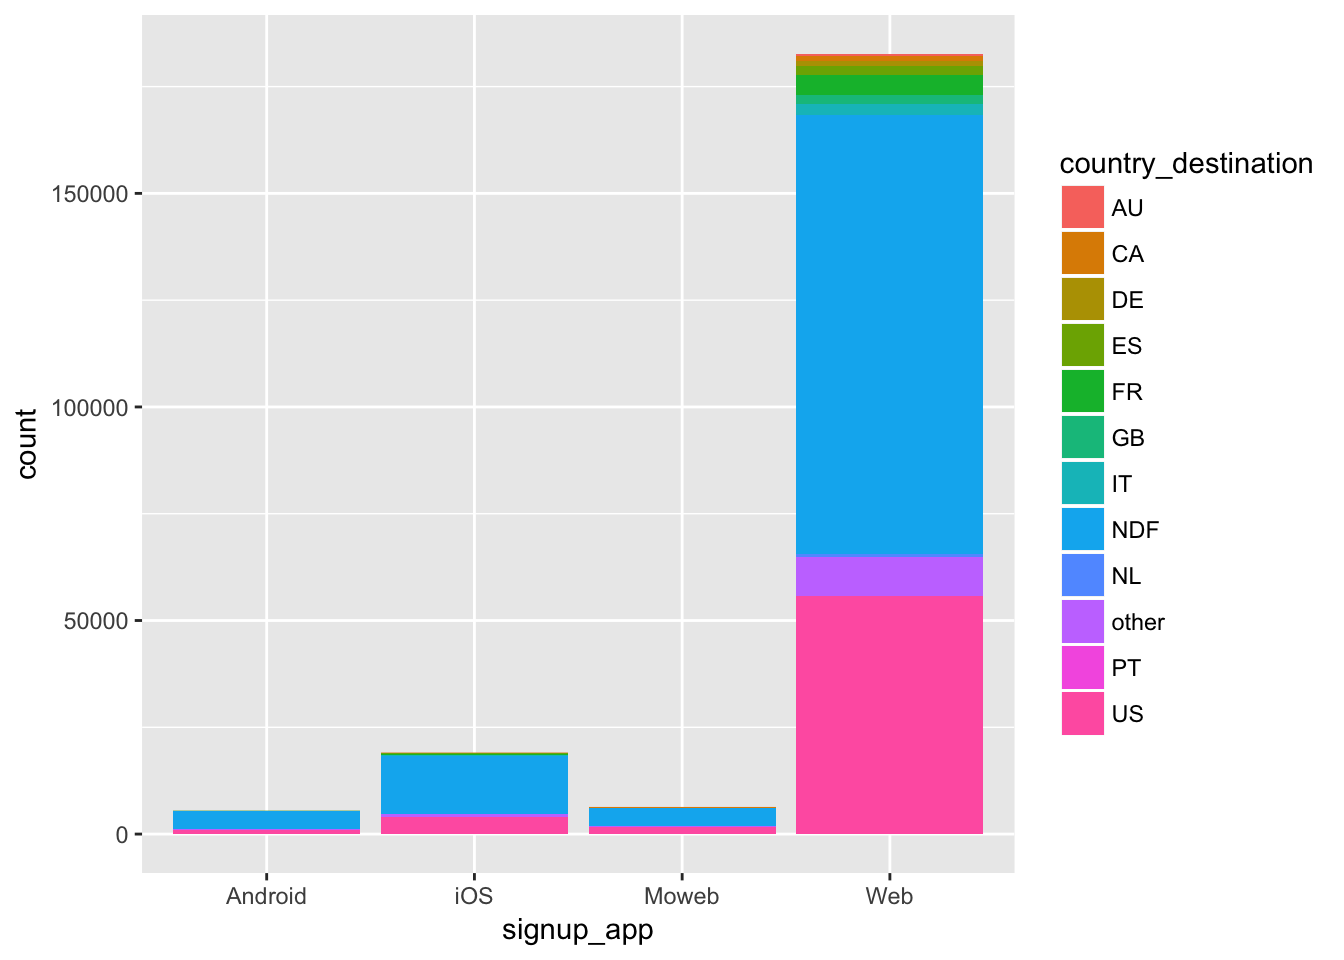
モバイルアプリからの利用は1割を下回り、大半がwebを利用している。
使用言語と旅行先
group_by(train, language, country_destination) %>%
  summarise(count = n()) %>%
  ggplot(aes(x = as.factor(language), y = count, fill = country_destination)) +
  geom_bar(stat = "identity") +
  labs(x = "language")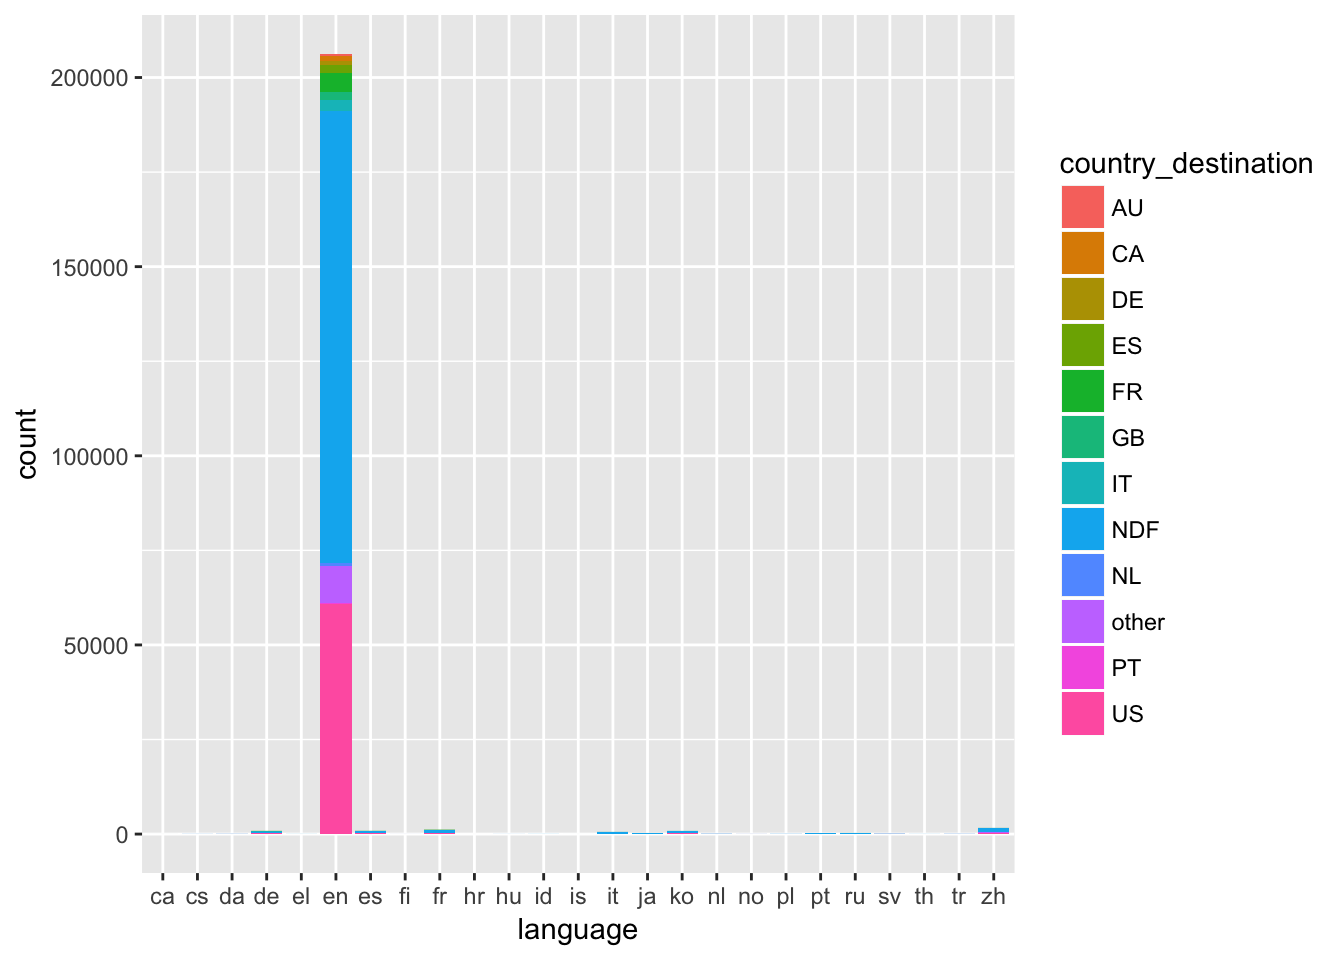
ユーザーの性別と旅行先
group_by(train, gender, country_destination) %>%
  summarise(count = n()) %>%
  ggplot(aes(x = as.factor(gender), y = count, fill = country_destination)) +
  geom_bar(stat = "identity") +
  labs(x = "gender")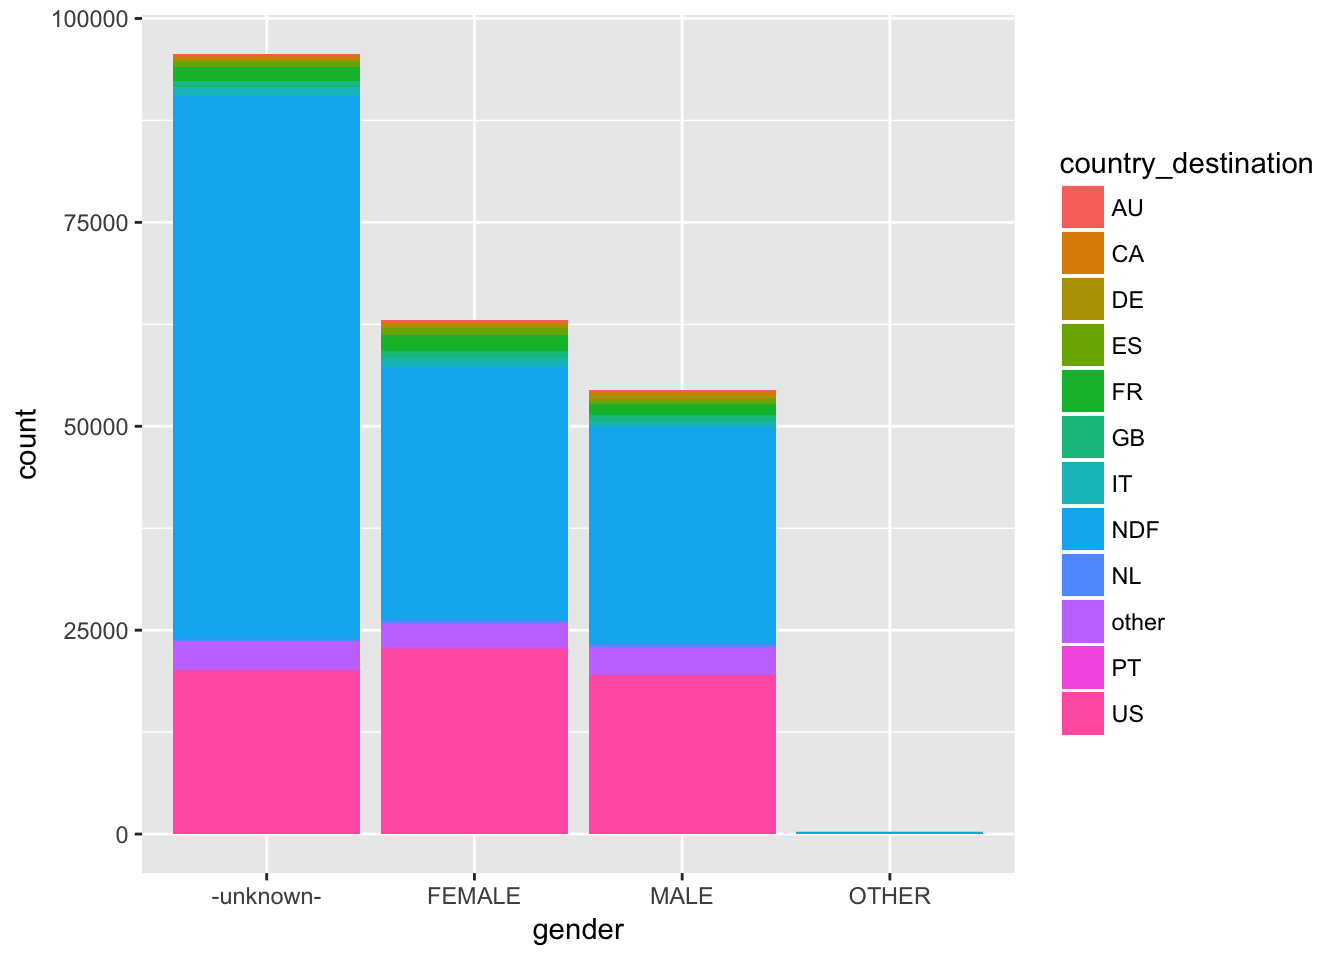
まとめ
- 約6割のユーザが旅行には利用しておらず、データソースが米国人なので旅行の行き先はほぼ国内(US)
- ユーザの中心が30代
- モバイルアプリからの利用は1割を下回り、大半がwebを利用している