Case3. 需要を予測する
- データの理解
与えられたデータについて見ていき、現状把握や、需要に影響を及ぼす要因を探っていきます。
kaggle data description (データの説明)
過去2年間(2011-2012)の、1時間ごとのレンタルデータ、気象条件等のデータが提供されています。
気象条件等のデータ
- datetime:時間
- seazon:季節(1 = 春, 2 = 夏, 3 = 秋, 4 = 冬)
- holiday:休日かどうか
- workingday:週末でも休日でもない
- weather:天気(晴れ、曇り、… )
- temp:温度
- atemp:体感温度?
- humidity:湿度
- windspeed:風速
- casual:非会員のレンタル数
- registered:会員のレンタル数
- count:総レンタル数
ここからは、実際にデータを整理していきます(コード部分に興味のない人はコードは読み飛ばして頂いて結構です)。
参考:
https://www.kaggle.com/thilakshasilva/predicting-bike-rental-demand
https://www.kaggle.com/h19881812/data-vizualization/code
準備
# ライブラリの読み込み
library(data.table)
library(dplyr)
library(stringr)
library(ggplot2)
library(xts)
library(lubridate)

# データの読み込み
train <- fread("./data/case03_train.csv", showProgress = FALSE, data.table = FALSE)
総レンタル数
予測対象の総レンタル数(count)を見ていきます。2011年に比べ2012年の方が増えているようです。
plot(train$count, type = "l",main = "")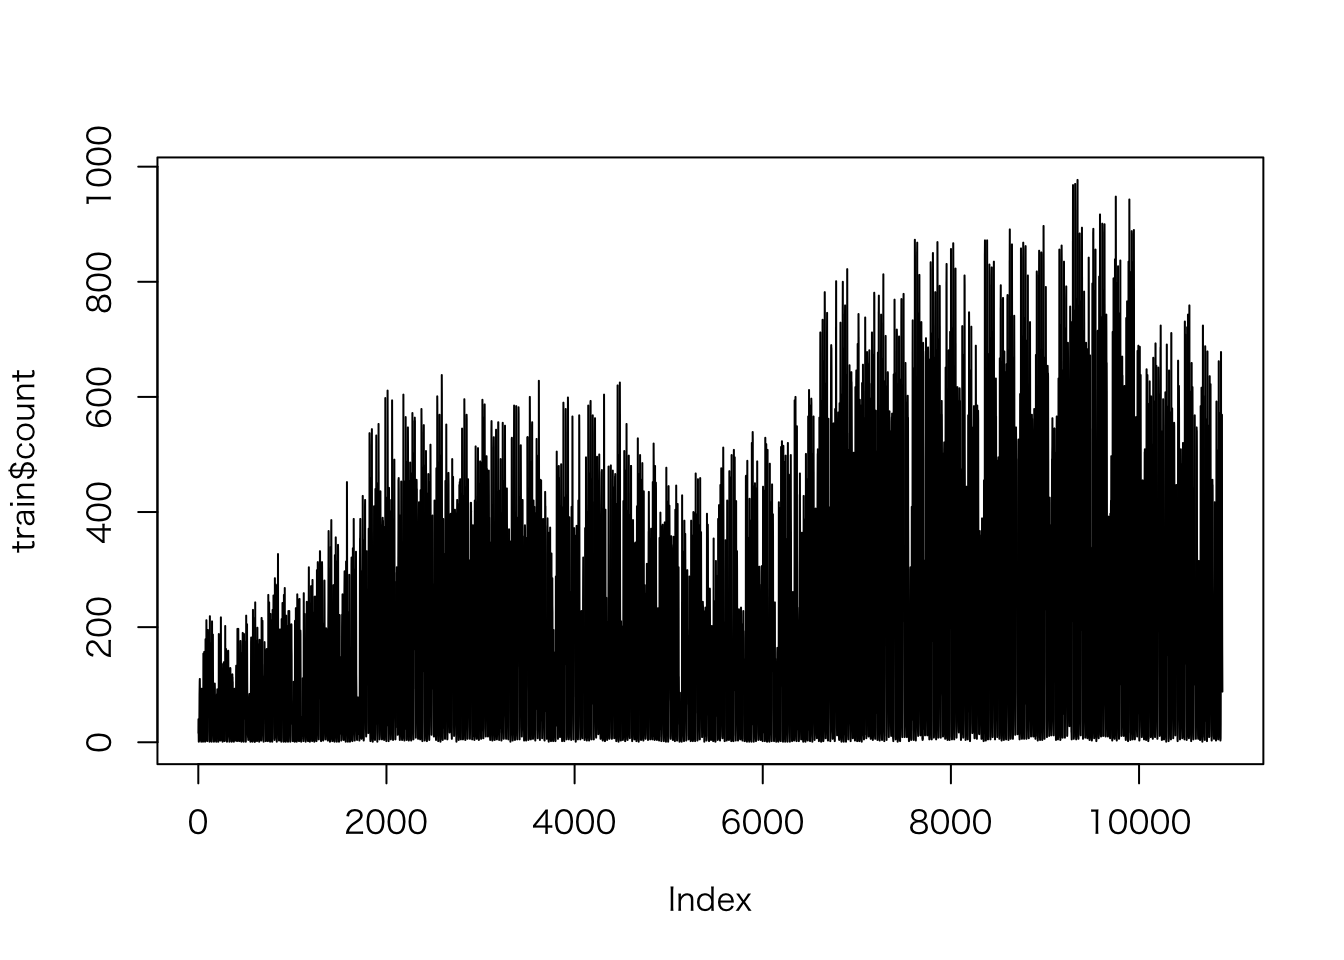
利用者側の視点で考えると、利用する時間帯がある程度固定される(通勤、通学に利用するなど)ことが考えられます。そこで時間ごとのレンタル数を見てみます。
train$hour    <- factor(hour(ymd_hms(train$datetime)))
group_by(train, hour) %>%
  summarise(mean_count = mean(count)) %>%
  ggplot(aes(x = as.integer(hour) -1, y = mean_count)) +
  geom_line() +
  labs(x = "hour")
やはり通勤通学時間でのレンタル数が多いことが見られます。「時間」は需要予測に重要な要因であることが考えられます。
季節
train$season  <- factor(train$season, labels = c("Spring", "Summer", "Fall", "Winter"))
group_by(train, hour, season) %>%
  summarise(mean_count = mean(count)) %>%
  ggplot(aes(x = as.integer(hour) -1, y = mean_count, colour = season)) +
  geom_line() +
  labs(x = "hour")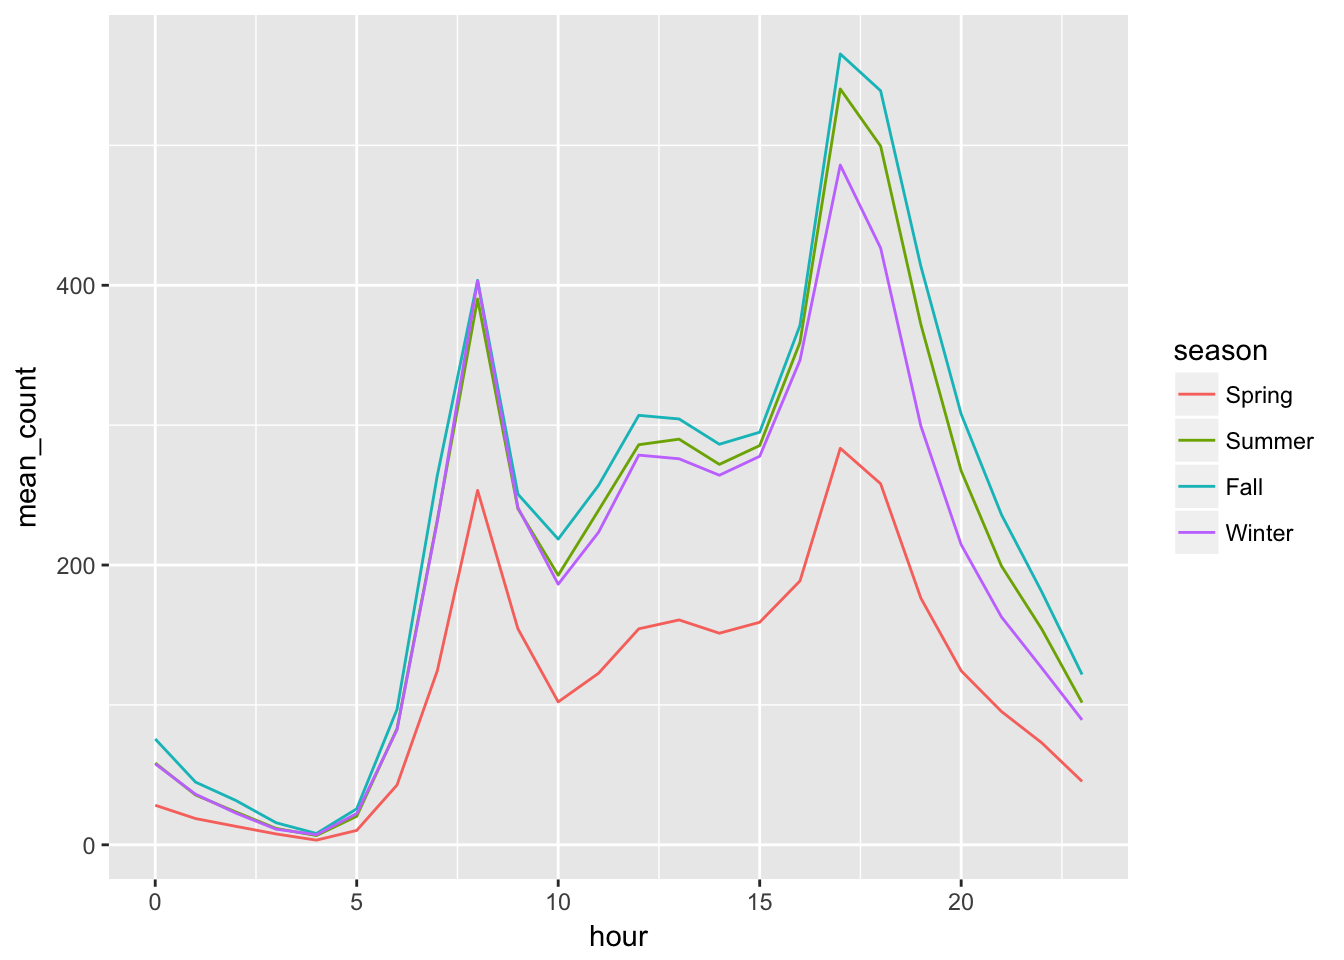
春にレンタル数が落ち込んでいることが見られます。また、どの季節でも時間帯ごとの傾向は似通っていることもうかがえます。ただし、全期間のレンタル数(最初のグラフ)では冬にレンタル数が落ち込んでいます、これはkaggleのデータ説明 が間違えているのかもしれません。
休日かどうか
train$holiday  <- factor(train$holiday, labels = c("FALSE", "TRUE"))
group_by(train, hour, holiday) %>%
  summarise(mean_count = mean(count)) %>%
  ggplot(aes(x = as.integer(hour) -1, y = mean_count, colour = holiday)) +
  geom_line() +
  labs(x = "hour")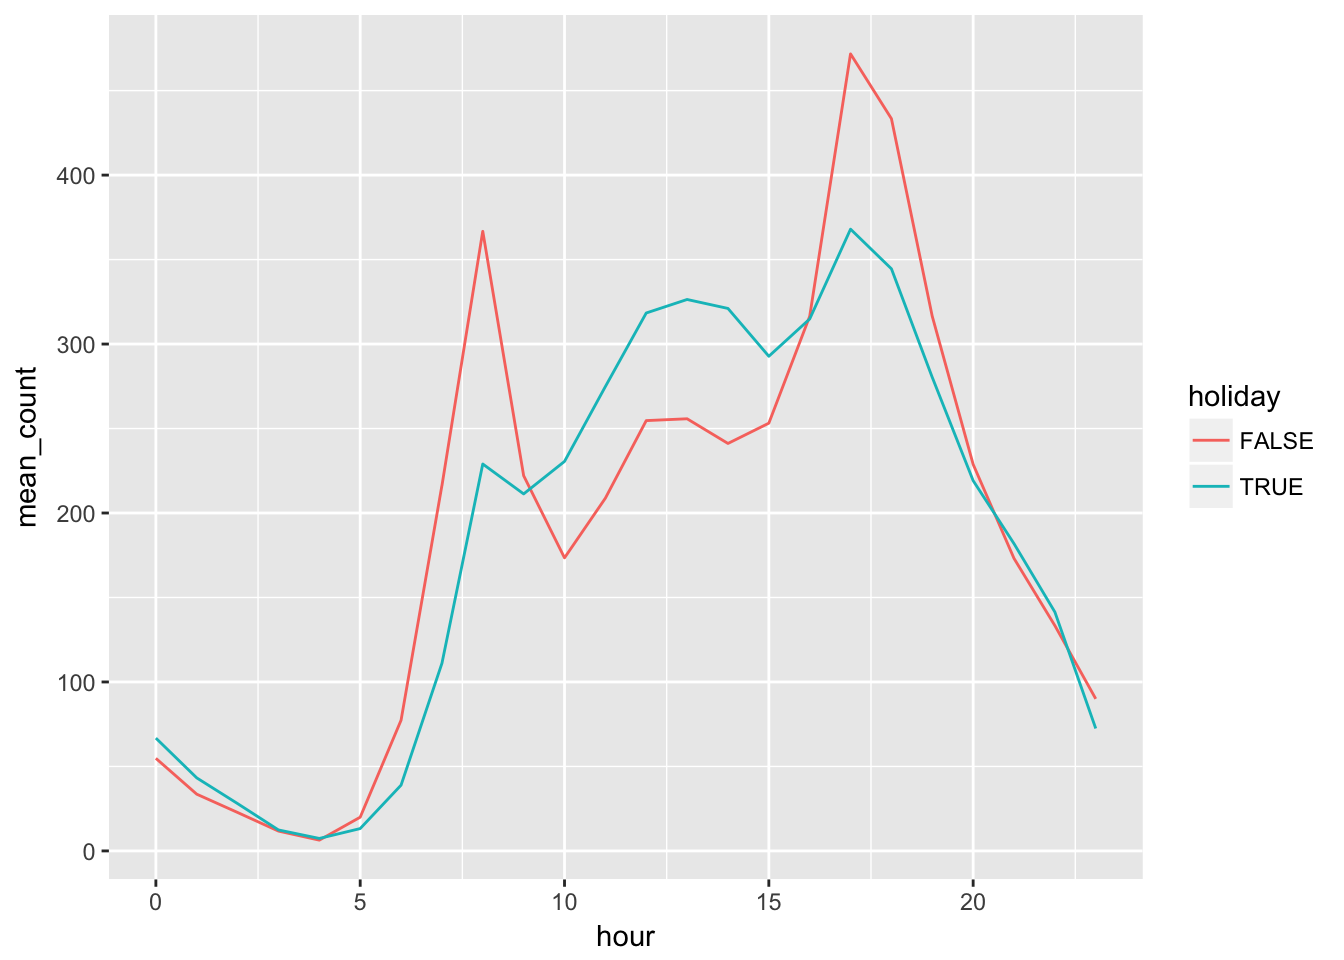
休日では、休日でない日に比べ通勤通学時間帯のレンタル数が少ないようです。
週末でも休日でもない
train$workingday  <- factor(train$workingday, labels = c("FALSE", "TRUE"))
group_by(train, hour, workingday) %>%
  summarise(mean_count = mean(count)) %>%
  ggplot(aes(x = as.integer(hour) -1, y = mean_count, colour = workingday)) +
  geom_line() +
  labs(x = "hour")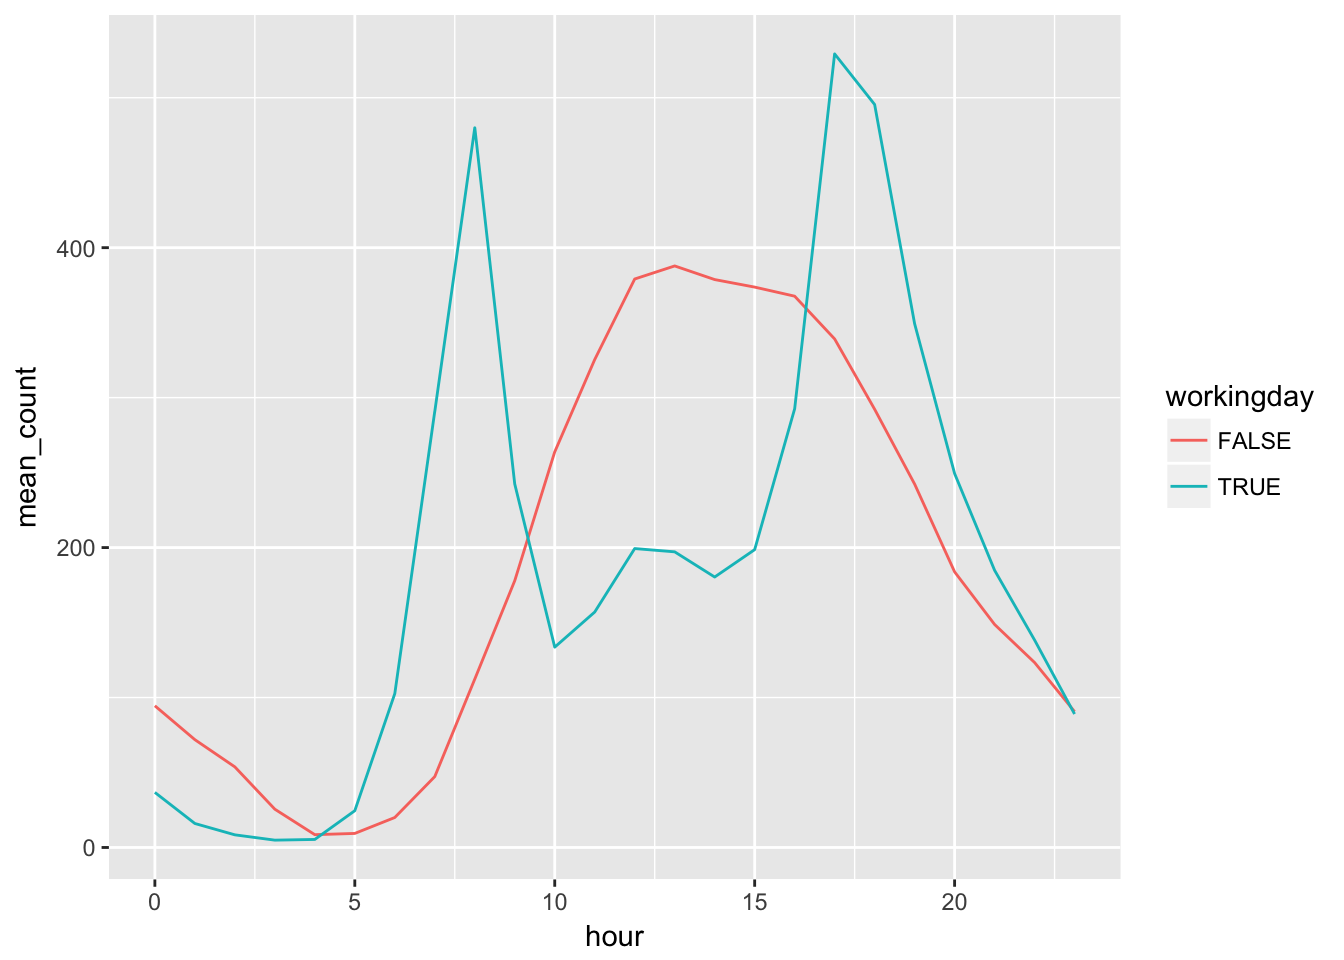
週末、休日はお昼頃にレンタル数が増える傾向にあるようです。
天気
train$weather <- factor(train$weather, labels = c("Good", "Normal", "Bad", "Very Bad"))
group_by(train, hour, weather) %>%
  summarise(mean_count = mean(count)) %>%
  ggplot(aes(x = as.integer(hour) -1, y = mean_count, colour = weather)) +
  geom_line() +
  labs(x = "hour")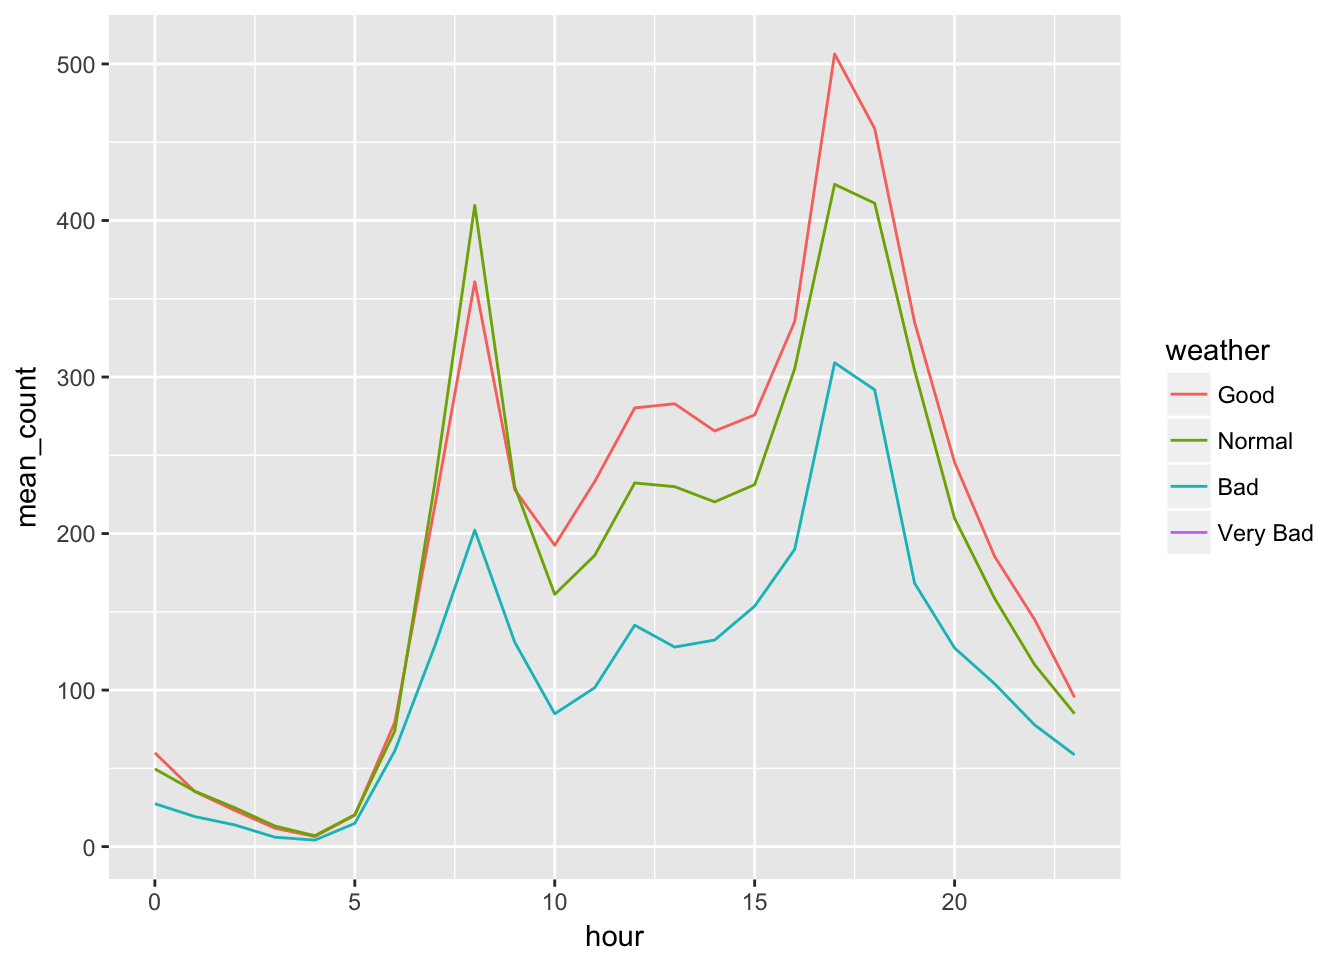
天気が良いほどレンタル数が多くなる傾向が見られます。
温度
group_by(train, hour, temp) %>%
summarise(mean_count = mean(count)) %>%
ggplot(aes(x = hour, y = temp, fill = mean_count)) +
    geom_tile() +
    scale_fill_gradient(low = 'lightblue', high = 'cyan4') +
    labs(x = 'hour', y = '', fill = 'count') +
    theme_bw() +
    theme(legend.position = 'bottom')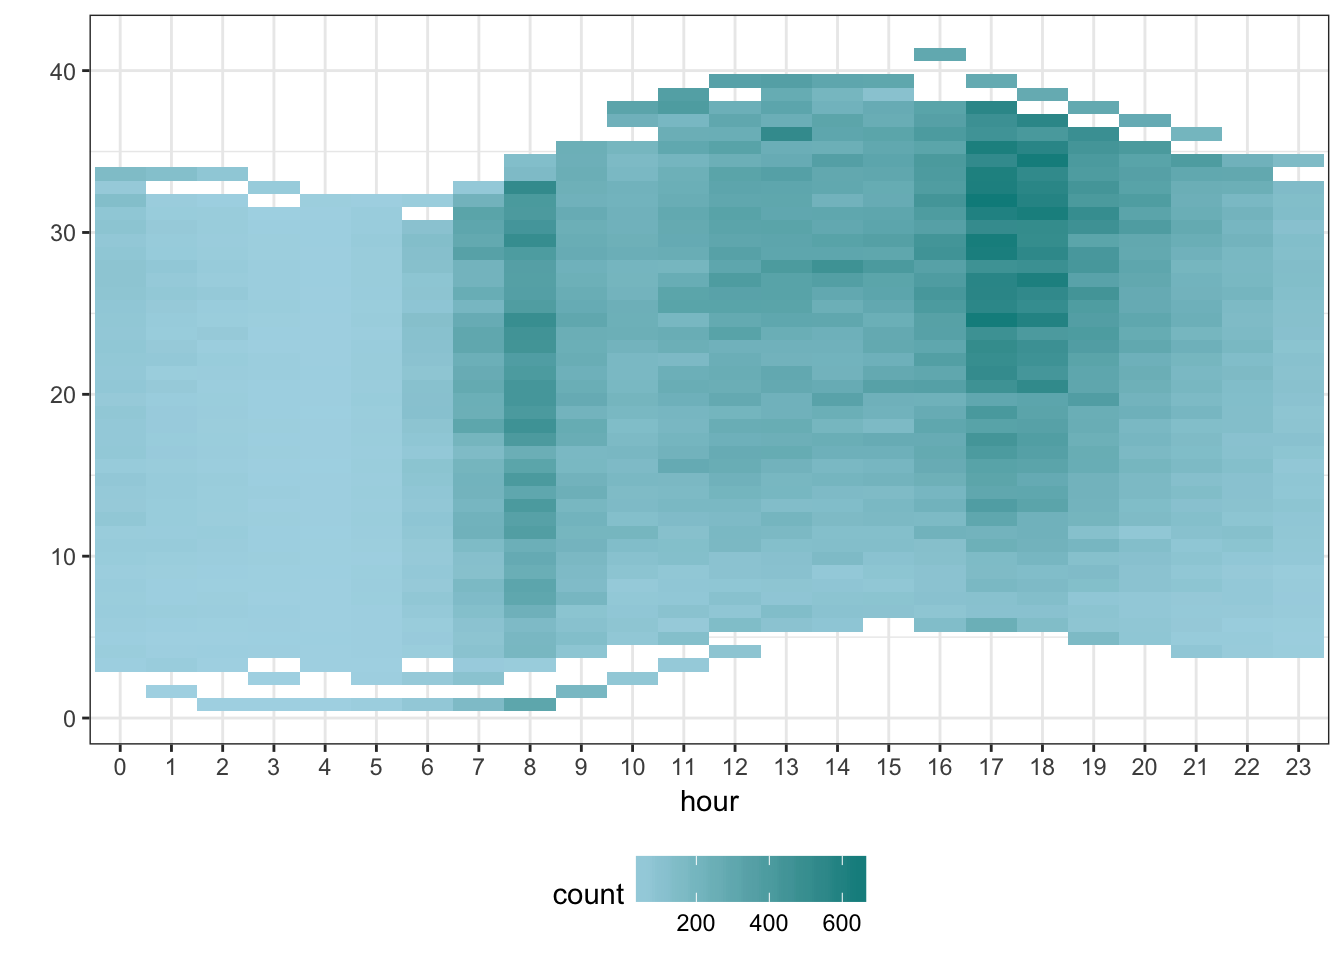
通勤通学の時間帯では、温度が20度を下回ると若干レンタル数が減少するようです。
体感温度
group_by(train, hour, atemp) %>%
summarise(mean_count = mean(count)) %>%
ggplot(aes(x = hour, y = atemp, fill = mean_count)) +
    geom_tile() +
    scale_fill_gradient(low = 'lightblue', high = 'cyan4') +
    labs(x = 'hour', y = '', fill = 'count') +
    theme_bw() +
    theme(legend.position = 'bottom')
「温度」と同様に、通勤通学の時間帯では、20度を下回ると若干レンタル数が減少するようです。
湿度
group_by(train, hour, humidity) %>%
summarise(mean_count = mean(count)) %>%
ggplot(aes(x = hour, y = humidity, fill = mean_count)) +
    geom_tile() +
    scale_fill_gradient(low = 'lightblue', high = 'cyan4') +
    labs(x = 'hour', y = '', fill = 'count') +
    theme_bw() +
    theme(legend.position = 'bottom')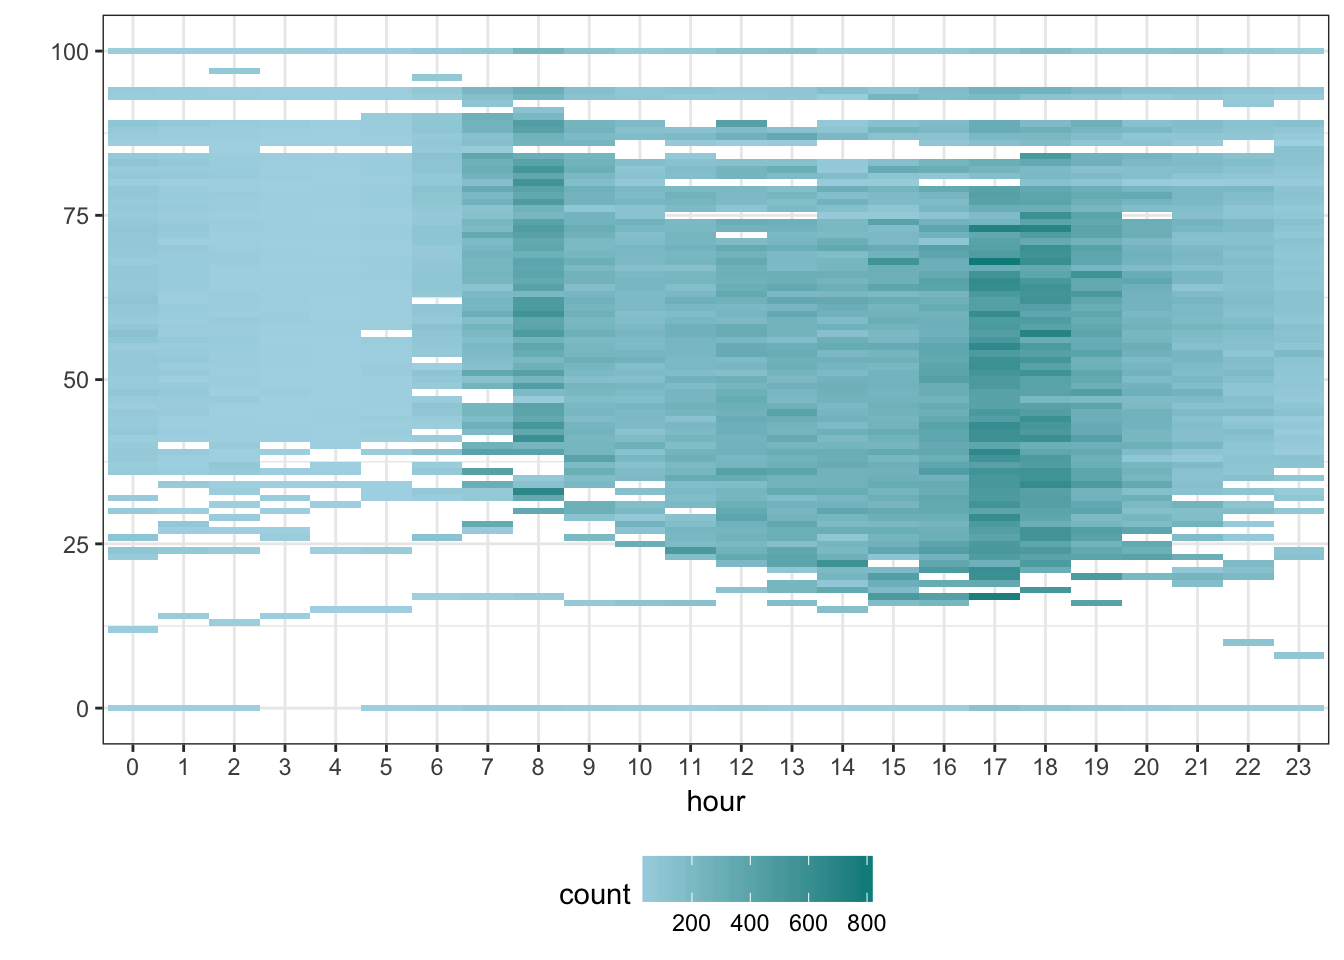
湿度はレンタル数にほとんど影響を与えないようです。
風速
group_by(train, hour, windspeed) %>%
summarise(mean_count = mean(count)) %>%
ggplot(aes(x = hour, y = windspeed, fill = mean_count)) +
    geom_tile() +
    scale_fill_gradient(low = 'lightblue', high = 'cyan4') +
    labs(x = 'hour', y = '', fill = 'count') +
    theme_bw() +
    theme(legend.position = 'bottom')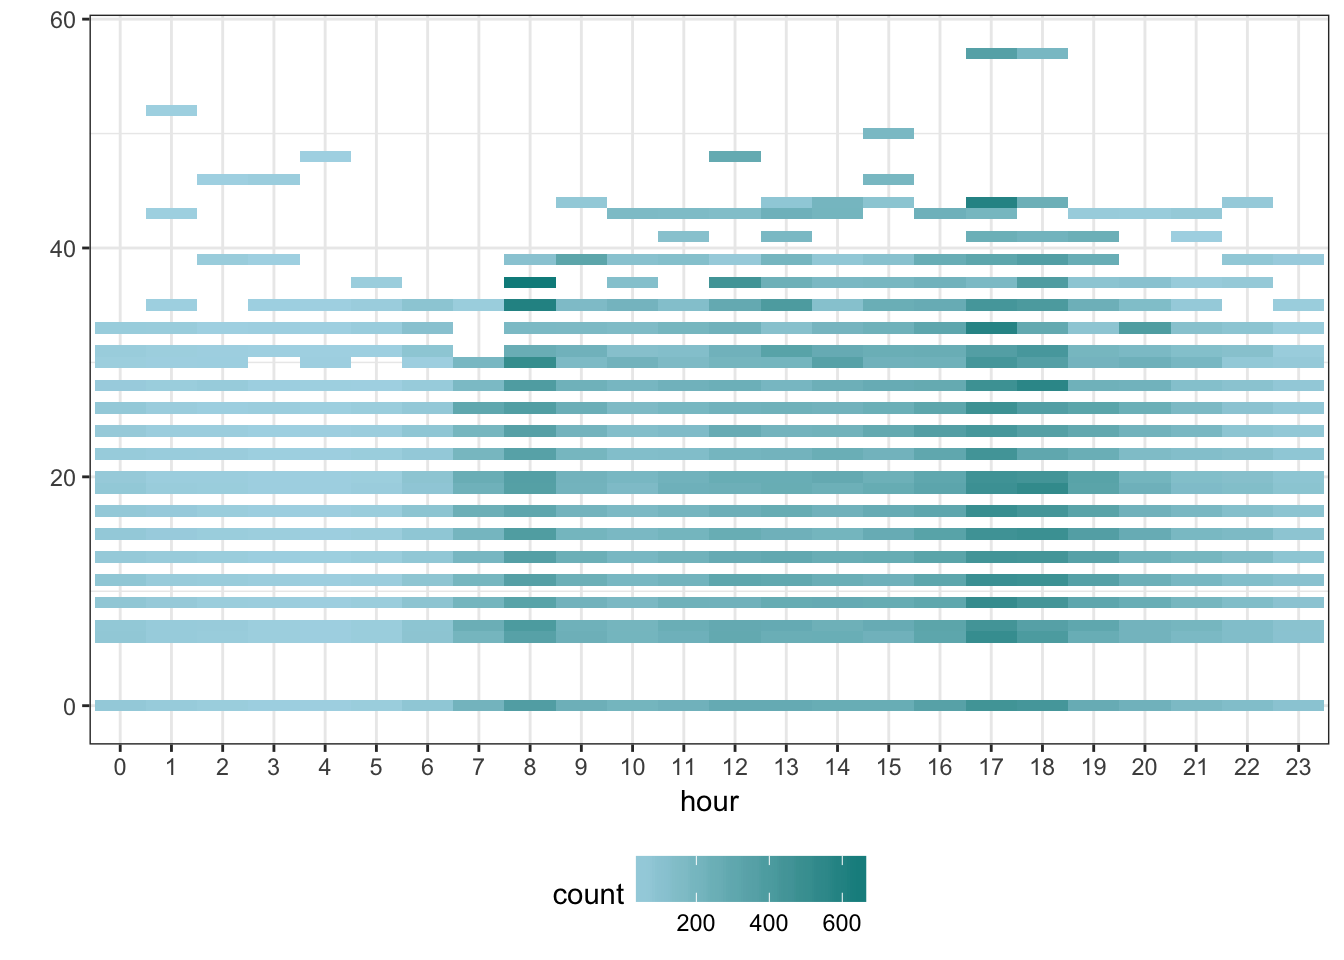
風速はレンタル数にほとんど影響を与えないようです。
まとめ
- 2011年に比べ2012年の方がレンタル数が増えている
- 春にレンタル数が減少する
- 平日では通勤通学の時間帯にレンタル数が多い
- 休日、週末ではお昼頃にレンタル数が多い
- 温度、体感温度が20度を下回るとレンタル数が減少する
- 湿度、風速はレンタル数への影響はほとんどない